PROJECTS
FinVAR: The LLM Version
Developed using LangChain and Chainlit, it leverages and upgrades LLMs as a stepping stone for fiduciary-level stock risk analysis. Built a multi-source data pipeline that analyzes any publicly traded ticker across all market sectors, integrating real-time financial data, news sentiment, and 10-K risk factors from SEC Edgar files, FinnHub, FinancialModelingPrep, and OpenAI APIs. Designed the system to deliver comprehensive risk assessments—from blue-chip stocks to small-cap companies—helping users make informed investment decisions based on live market data. Click on the image to check it out.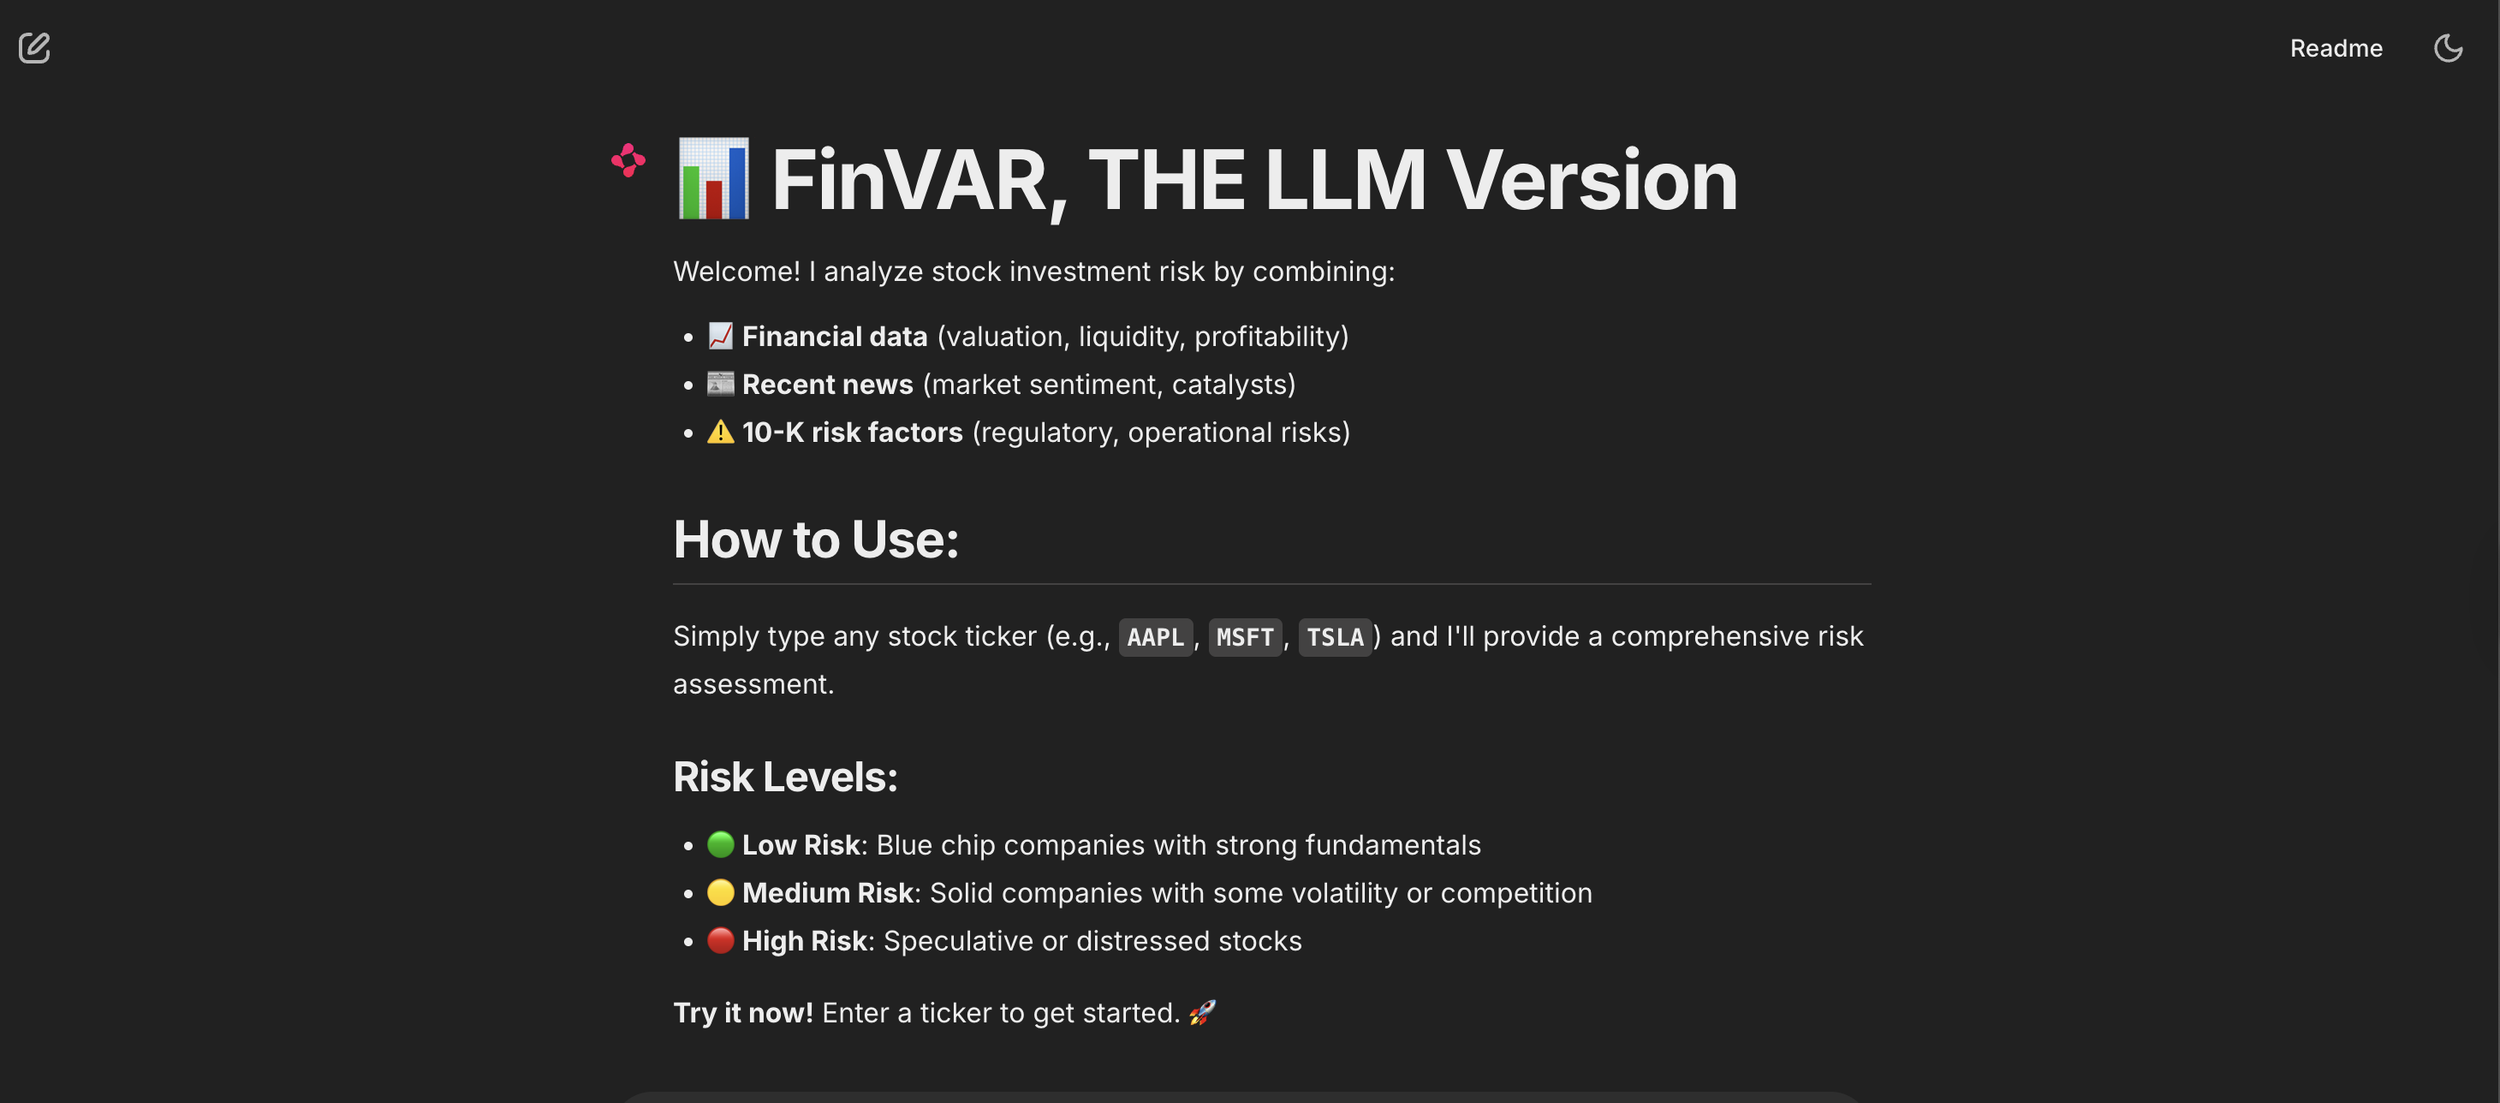
NEWISE_GIS
Created NEWISE_GIS to solve a common problem: finding the right place to live in New England shouldn't require endless Google searches. Engineered an interactive visualization platform that aggregates and displays regional data on income, education, crime, and demographics, helping users make informed relocation decisions through intuitive geographic comparisons. Click on the image to check it out.
FinVAR – Financial Assistant Referee
Created FinVAR to bridge the gap between financial analysis and predictive insights for investors. Traditional tools show historical metrics but lack forward-looking capabilities—FinVAR solves this by combining interactive visualizations of profitability, growth, leverage, and liquidity metrics with a Machine Learning model that predicts future EPS. Engineered a Gradient Boosting algorithm trained on historical financial ratios and integrated the Yahoo Finance API to auto-fetch real-time data, delivering end-to-end analysis from current performance to future projections in a single platform. Click on the image to check it out.
Appropriations Equity Analysis for Massachusetts Senator Edward Markey’s Office
Collaborated with Senator Markey's office to transform Massachusetts funding data into actionable intelligence. Engineered interactive geospatial visualizations using Python, Folium, and OpenStreetMap API to map population and per capita funding across all state municipalities. Built a LookerStudio dashboard for stakeholder presentations and led biweekly strategy sessions to translate data insights into policy recommendations. Click on the image to check it out